
Credits for Images from Astra's Spectroscopy Demo
This page contains the credits to the images used in Astra's spectroscopy light lesson gallery.
Topics Covered in Light Lessons may be accesed by clicking below:
- Introduction
- Light Basic - How Light Works
- Electromagnetic Spectrum - Light Radiation is continuous
- Radio Light - The Longest Wavelength
- Microwave Radiation
- Infrared Light
- Visible Light - as seen by humans
- Ultraviolet Light
- X-Ray Radiation
- Gamma Radiation
Why Light is So Fantastic
Introduction
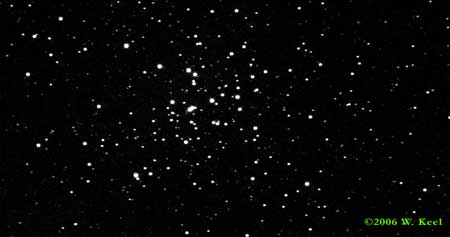
Spectroscopy is the analysis of the spectra produced when matter interacts with or emits electromagnetic radiation. Stars make themselves known to us by the light that shines from them. While charting the stars, humans began to understand the true nature of light.
Credits:
This image was taken by William Keel of M-37. It has been used to illustrate stars for the stellar cartography module at Astra's Star Gate. The original image can be found at: http://www.astr.ua.edu/gifimages/m37.html along with Bill's original caption.
![]() Return to this section of Spectroscopy
Return to this section of Spectroscopy
Visible Light passing through a Prism
The Prism
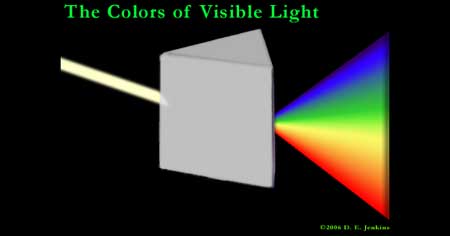
When visible light is passed through a prism, it breaks down into individual colors. This is because light travels through the universe in waves.
Light is bent in a prism, a property called, refraction. The rays of visible light enter one through a surface of the prism. They are bent by the surfaces where they enter and exit. Because light from the various colors travel at different wavelengths, they are separated by the refraction and are unable to blend together again when they pass out of the glass.
Credits:
This image of a prism is ©2005-2023 Dawn E. Jenkins aka Astra
![]() Return to this section of Spectroscopy
Return to this section of Spectroscopy
The Full Spectrum of Electromagnetic Radiation
Electromagnetic Radiation
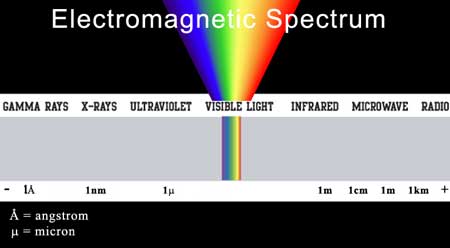
The Electromagnetic spectrum is continuous. The tiniest waves are measured in angstroms, a unit of length equal to one hundred-millionth of a centimeter. Waves of visible light are measured in nanometers (nm), while waves in infrared to radio are measured in more familiar meters.
Credits:
This image of the Electromagnetic Spectrum is ©2005-2023 Dawn E. Jenkins aka Astra
![]() Return to this section of Spectroscopy
Return to this section of Spectroscopy
Light at "Radio" Wavelengths
Radio Light
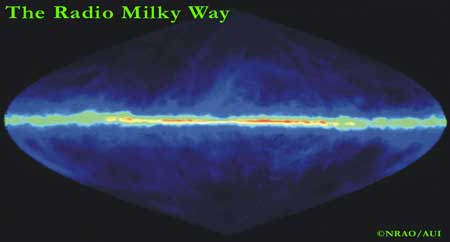
This image shows the Milky Way galaxy as it would appear if we could see the electromagnetic energy the hydrogen in the galaxy emits in the Radio region, specifically the 21-cm wavelength. This image is computer generated from data collected by various radio telescopes.
Full Caption:
National Radio Astronomy Observatory - Hydrogen Sky
This figure shows the distribution of atomic hydrogen at all locations in the sky. All of this hydrogen is in our galaxy. Red indicates directions of high hydrogen density, blue and black show areas with little hydrogen. The figure is centered on the galactic center and galactic longitude increases to the left. The data came from measurements of the 21cm line of hydrogen by radio telescopes. Some of the hydrogen loops outline old supernova remnants. This image is a composite from many 21cm surveys. It includes data from the NRAO Green Bank, West Virginia 140- foot and 300-foot telescopes, the 85-foot Hat Creek Telescope of The University of California at Berkeley, The AT&T Bell-Labs Horn-Reflector Telescope at Holmdel, New Jersey and The 60-foot Telescope at the Parkes Radio Observatory in Australia.
Credits
Investigators: J.M. Dickey and F.J. Lockman
![]() Return to this section of the Spectroscopy
Return to this section of the Spectroscopy
Microwave Radiation
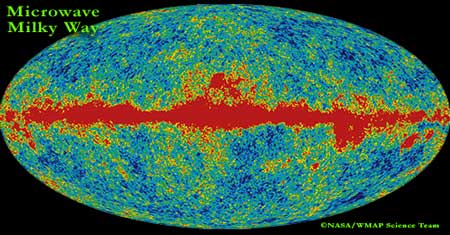
Microwave Light
This image is part of an all-sky survey taken with the COBE satellite. The red band across the image comes from energy radiated by the Milky Way in the microwave region of the spectrum.
Caption from the WMAP site:
This image show a WMAP full-sky map in the Q-band frequency of 41 GHz. The red band in the image is microwave emission from our Galaxy. The Galactic signal is strongest at 23 GHz, weakest at 61 and 94 GHz. This data is used to subtract the Galactic signal and produce the final Cosmic Microwave Background map. (Not shown on this site, but may be found by clicking the link.
Launched on June 30, 2001, WMAP has been operating in L-2 orbit (a special orbit betwen the Earth and its moon that requires a minimal amount of effort to remain stable.) The mission of WMAP was to map the Cosmic Microwave Background temperature over the full sky, the first all-sky survey was published in February of 2003
Credits:
NASA/WMAP Science Team
![]() Return to this section of Spectroscopy
Return to this section of Spectroscopy
Light at Infrared Wavelengths
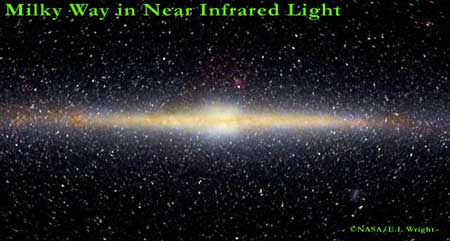
Infrared Light
This image is part of an all-sky survey taken with the COBE satellite using the DIRBE instrument. The reddish light across the center of the image comes from energy radiated by the Milky Way in the infrared region of the spectrum. Credit for this images goes to the NASA/WMAP Science Team.
Full Caption (copied from the web site listed below)
False-color image of the near-infrared sky as seen by the DIRBE. Data at 1.25, 2.2, and 3.5 µm wavelengths are represented respectively as blue, green and red colors. The image is presented in Galactic coordinates, with the plane of the Milky Way Galaxy horizontal across the middle and the Galactic center at the center. The dominant sources of light at these wavelengths are stars within our Galaxy. The image shows both the thin disk and central bulge populations of stars in our spiral galaxy. Our Sun, much closer to us than any other star, lies in the disk (which is why the disk appears edge-on to us) at a distance of about 28,000 light years from the center. The image is redder in directions where there is more dust between the stars absorbing starlight from distant stars. This absorption is so strong at visible wavelengths that the central part of the Milky Way cannot be seen. DIRBE data will facilitate studies of the content, energetics and large scale structure of the Galaxy, as well as the nature and distribution of dust within the Solar System. The data also will be studied for evidence of a faint, uniform infrared background, the residual radiation from the first stars and galaxies formed following the Big Bang.
Website: COBE - DIRBE Science Images
Astronomy Picture of the Day: January 30, 2000
Credits:
E. L. Wright (UCLA), The COBE Project, DIRBE, NASA
![]() Return to this section of Spectroscopy
Return to this section of Spectroscopy
Visible Light as Seen by Humans
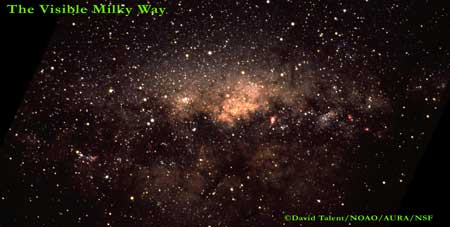
Visible Light
Here is the Milky Way galaxy in visible light, somewhat like what you might see at a dark site, except that a camera collects light longer than your eye is able to gather it. This is the center of our galaxy, rather than the entire length of it, as are the other images.
Full Caption (taken from the web site listed below)
A wide angle view toward the center of our own Milky Way galaxy. The teapot shape of the stars in the constellation Sagittarius can be seen but the central region of the Galaxy is obscured from sight by intervening gas and dust clouds, and by the myriad stars between Earth and the Galactic core. Taken by David Talent at the Cerro Tololo Inter-American Observatory in Chile.
Website: Web Address to Access Image - National Optical Astronomy Observatory (NOAO)
Credits:
David Talent/NOAO/AURA/NSF
![]() Return to this section of Spectroscopy
Return to this section of Spectroscopy
Light in the Ultraviolet region of the Electromagnetic Spectrum
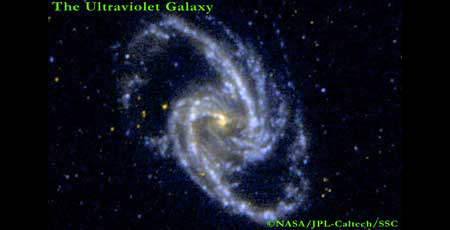
Ultraviolet Light
This ultraviolet image of a galaxy called NGC 1365, is similar to how we currently believe our galaxy, the Milky Way, appears from the outside. It is a barred spiral type because of the bar-like quality of its central structure.
Full Caption
Ultraviolet image of the barred spiral galaxy NGC 1365, which is a member of the Fornax Cluster of Galaxies.
Web Site: Galaxy Evolution Explorer - The Galaxy Evolution Explorer (GALEX), is a small satellite observatory launched on April 28 2003, it's primary mirror is 50 cm, just under 20 inches. It was designed to increase our knowledge of how galaxies evolve and change by studying their ultraviolet output.
Credits:
NASA/JPL-Caltech/SSC
![]() Return to this section of Spectroscopy
Return to this section of Spectroscopy
X-Ray Light Waves are Highly Energetic
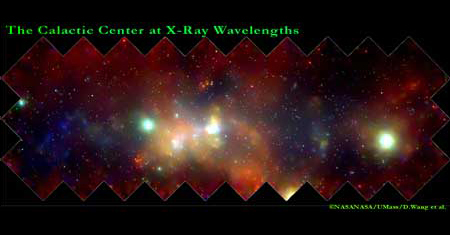
X-Ray Radiation
The image of the galactic center of the Milky Way is made of many images taken with the Chandra X-Ray Observatory. It covers an area smaller than the previous visible light image. The central white patch is believed to be a black hole at the center of our galaxy.
Full Caption (from the site listed below)
This 400 by 900 light-year mosaic of several Chandra images of the central region of our Milky Way galaxy reveals hundreds of white dwarf stars, neutron stars, and black holes bathed in an incandescent fog of multimillion-degree gas. The supermassive black hole at the center of the Galaxy is located inside the bright white patch in the center of the image. The colors indicate X-ray energy bands - red (low), green (medium), and blue (high).
The mosaic gives a new perspective on how the turbulent Galactic Center region affects the evolution of the Galaxy as a whole. This hot gas appears to be escaping from the center into the rest of the Galaxy. The outflow of gas, chemically enriched from the frequent destruction of stars, will distribute these elements into the galactic suburbs. Because it is only about 25,000 light years from Earth, the center of our Galaxy provides an excellent laboratory to learn about the cores of other galaxies.
Website: X-Ray Mosaic Of Galactic Center - from the Chandra X-Ray Observatory
![]() Return to this section of Spectroscopy
Return to this section of Spectroscopy
Radiation at Gamma Frequencies
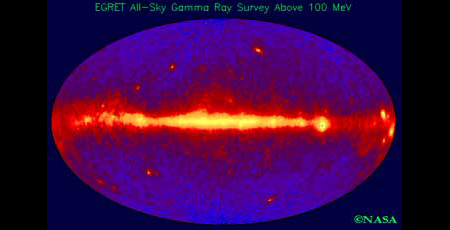
Gamma Rays
This image of the Milky Way galaxy is taken in the gamma ray region of the spectrum by Compton Gamma Ray Observatory. Gamma Waves are very energetic and are often detected in the form of gamma ray bursters. (GRBs)
Full Caption (taken from the web site listed below)
The Compton Gamma Ray Observatory (CGRO) is the second of NASA's "Great Observatories" (the first being the Hubble Space Telescope). The Energetic Gamma Ray Experiment Telescope (EGRET) provides the highest energy gamma-ray window for CGRO. EGRET's energy range is from 30 million electron volts (30 MeV) to 30 billion electron volts (30 GeV). EGRET is 10 to 20 times larger and more sensitive than previous detectors operating at these high energies and has made detailed observations of high energy processes associated with diffuse gamma-ray emission, gamma-ray bursts, cosmic rays, pulsars, and active galaxies known as gamma-ray blazars. The image above is an all-sky map in Galactic coordinates obtained by EGRET of gamma-ray emission at energies above 100 MeV. The brightest emission is colored yellow in this false-color image, while the faintest emission is blue. The plane of the Milky Way galaxy is clearly seen as a strong source of diffuse and resolved emission. The diffuse emission in the galactic plane is primarily due to cosmic ray interactions with the interstellar medium. The Vela, Geminga, and Crab pulsars are clearly visible as bright knots of emission in the galactic plane in the right portion of the slide. The gamma-ray blazar 3C279 is seen as the brightest knot of emission above the plane. This map was produced by combining EGRET observations from the first year of Compton Observatory operations. More information can be found at the CGRO Science Support Center website.
Website: The Universe at 100 MeV - NASA
Credits:
Compton Gamma Ray Observatory Team
![]() Return to this section of Spectroscopy
Return to this section of Spectroscopy
Return to the Spectroscopy App or Starfleet Page
This page was last updated 03/23/2023
Links to other Stargate Pages:
- Astronomy |
- Space |
- StarWimin |
- NE Asteroids |
- Ancient Astronomy |
- Observers |
- What's Up? |
- - Return to Astra's Stargate home